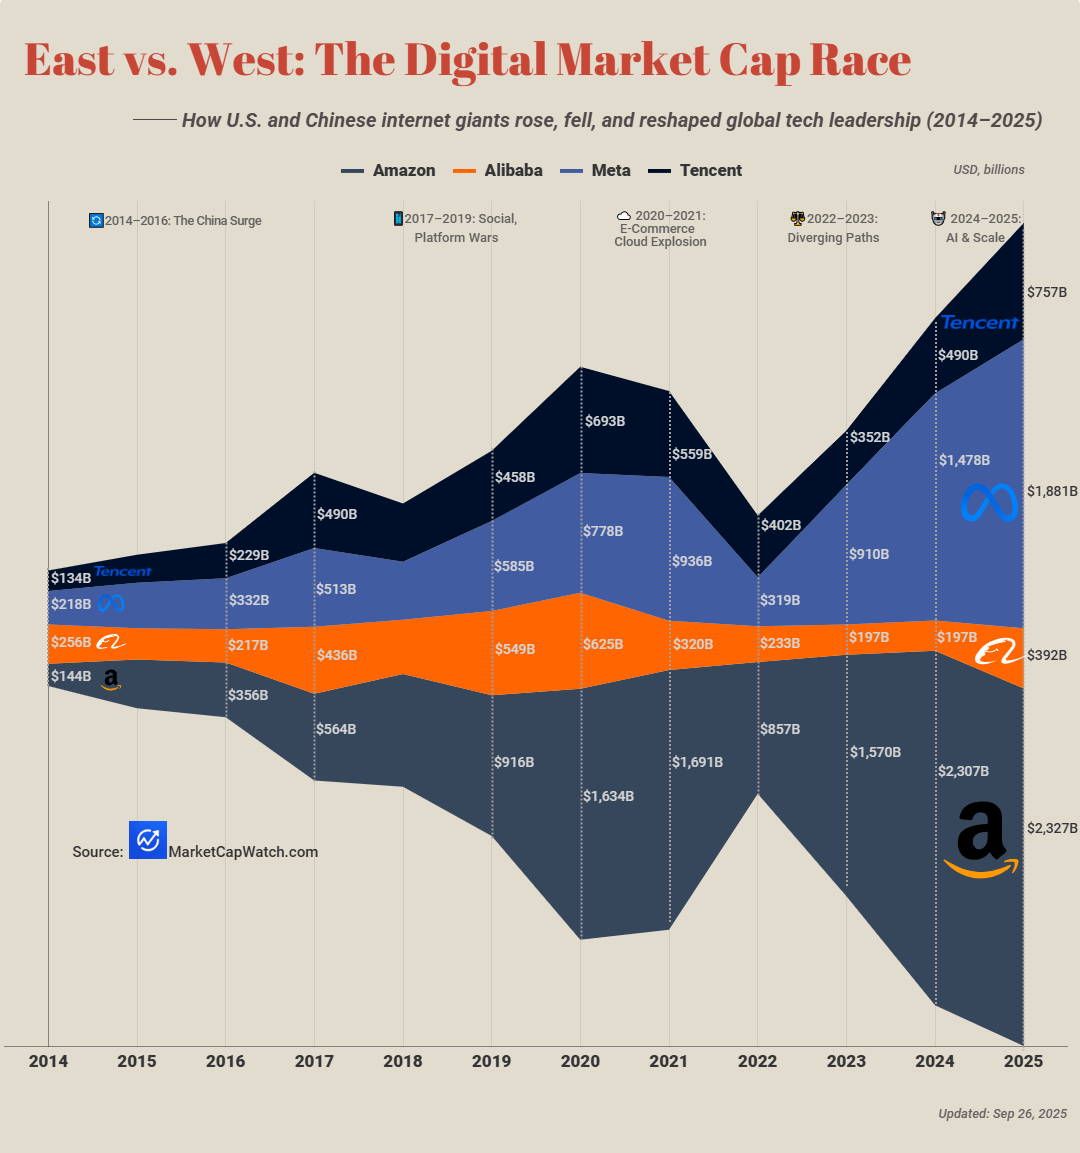
This chart tracks the shifting market cap of four internet powerhouses — Amazon, Meta, Alibaba, and Tencent — over the past decade. It highlights how U.S. firms surged ahead while Chinese peers peaked earlier and then slowed under regulatory and market pressures. 🔄 2014–2016: The China Surge Alibaba and Tencent rose rapidly on the back of China’s e‑commerce boom and mobile internet adoption, briefly rivaling U.S. tech peers.
📱 2017–2019: Social & Platform Wars Meta (Facebook) and Tencent both peaked as social platforms dominated global digital attention. Amazon’s steady climb reflected the shift to online retail and cloud.
☁️ 2020–2021: E‑Commerce & Cloud Explosion Amazon surged past $1.6T during the pandemic as e‑commerce and AWS cloud demand skyrocketed. Meta also hit near‑$1T, while Alibaba and Tencent reached their highs before regulatory headwinds.
⚖️ 2022–2023: Diverging Paths Chinese tech valuations cooled under regulation and slowing growth, while U.S. peers rebounded. Meta dipped sharply in 2022 but recovered with its AI pivot.
🤖 2024–2025: AI & Scale Amazon and Meta both crossed multi‑trillion valuations, driven by AI integration and cloud dominance. Tencent stabilized, while Alibaba lagged, showing the widening gap between U.S. and Chinese tech giants.
Source: MarketCapWatch